In a recent blog post, I explained how I ran monte carlo simulations on development projects in an attempt to underpin the ideal of “Improvement of Daily Work”. The simulations suggest that debt is the main factor killing all the projects that did not succeed. The mentioned post also brought up a lot of open questions, many of which concern the assumptions behind the simulation.
Hypothesis
There are different levels on which open questions remained: What are the parameters and functions that adequately reflect aspects like impact of debt on performance, interest rate of debt (how much more debt comes from existing debt?), how does investment in performance improvement really impact performance? Are there some universal parameters, even functions, after all? And is there a way to know what applies for a given endeavor, let alone in advance?
I do not have any objective information on either of these questions – and I doubt they even exist. So my hypothesis became that maybe, given the uncertainties around all these parameters, we need to find strategies that are less vulnerable to all those unknowns.
Changed Strategy and Parameters
So for the next set of simulations, I made one conceptual change: Instead of applying guard-rails for budgets, defining up-front how we distribute our capacity as a team to the three areas of (a) feature development, (b) debt reduction, and (c) performance improvement, this time we always fully pay down debt, then invest the remaining capacity along a defined ratio between (a) and (c). Note that “Improvement of Daily Work”, the Third Ideal as described by Gene Kim, basically consists of both (b) and (c).
Two subsequent tweaks have been made in addition:
- Extended range of debt interest rates: While the previous simulation only covered debt interest rates of 0.1, 0.2 and 0.25 (see original post for more background), I added 0.5 for the fun of it this time.
- Tuned down effectiveness of investing in performance: as compared to the last round of simulations, I reduced the effectiveness of investing in performance improvement by a factor of 0.75 (i.e. investment in performance improvement affects future performance 25% less than in the first simulation), after an initial run without such correction seemed to produce wildly unrealistic results.
In short, as you compare results with the previous simulations, keep in mind that this time we simulate higher debt interest rates AND lower impact from investing in performance.
Analysis
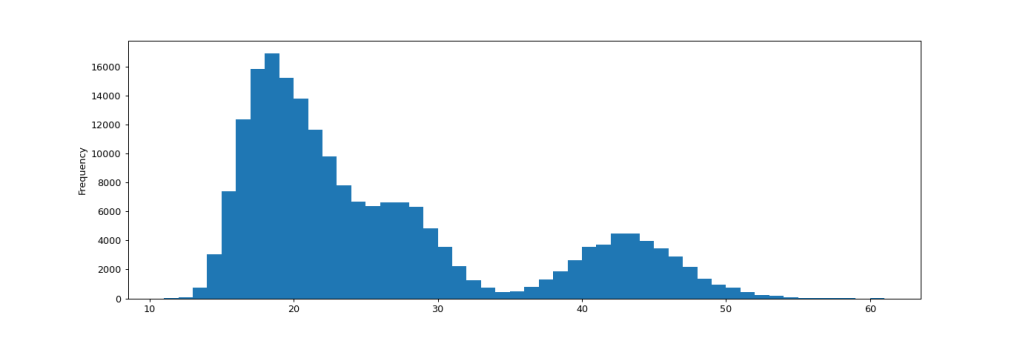
Even under these more difficult conditions, out of 200’000 simulated projects following the changed strategy, not a single one failed to deliver. The following histogram shows the frequency of each number of iterations used across all simulation runs. The slowest occurrence was completed after 61 iterations.
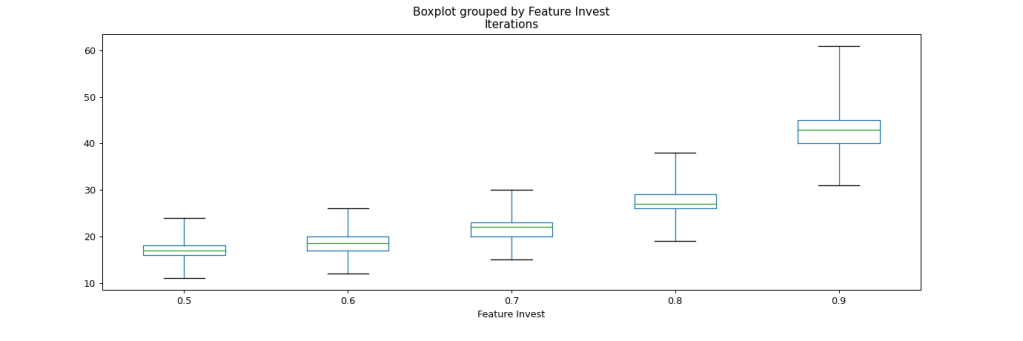
If we dig a bit deeper into how the number of required iterations is distributed, we find that we have a pretty consistent picture now. We still see the resemblance to a power-law distribution in the following box-plot chart, with higher shares of resources invested into feature development leading to longer development times. Note that in contrast to similar charts in the previous simulation, the max here is 61, not 100 iterations.
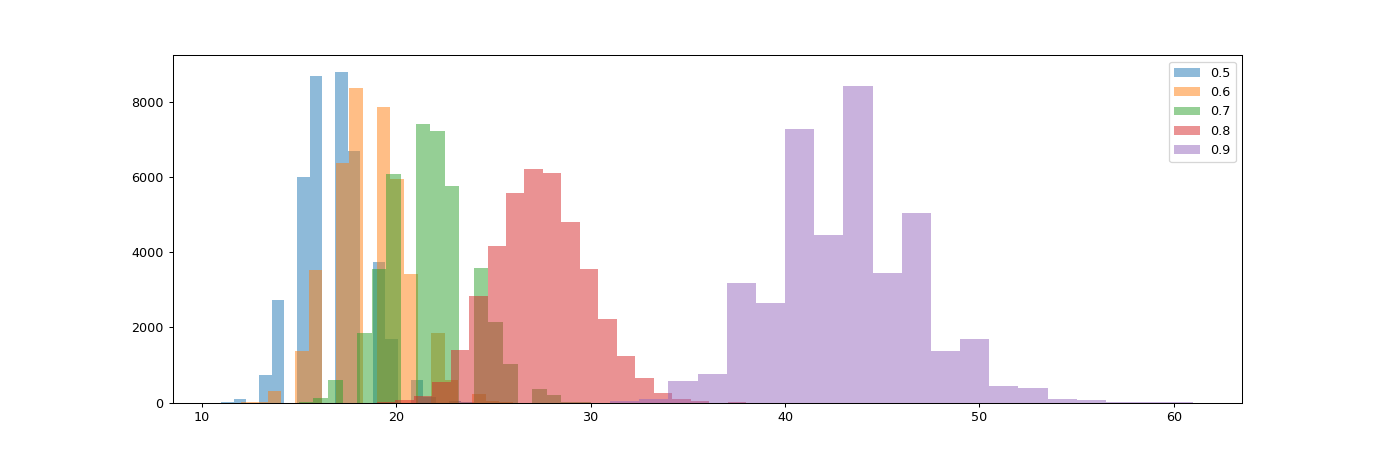
Splitting the histogram view per ratio invested into new features further visualizes the impact of this investment decisions. There are distinct distributions with a given mean per strategy.

If we look at the distribution by debt interest level, we can see that with the new strategy of working down debt before any other investments, we completely rule out the impact of debt interest rates. There’s simply no difference in project trajectories whether the debt interest is 10% or 50%.
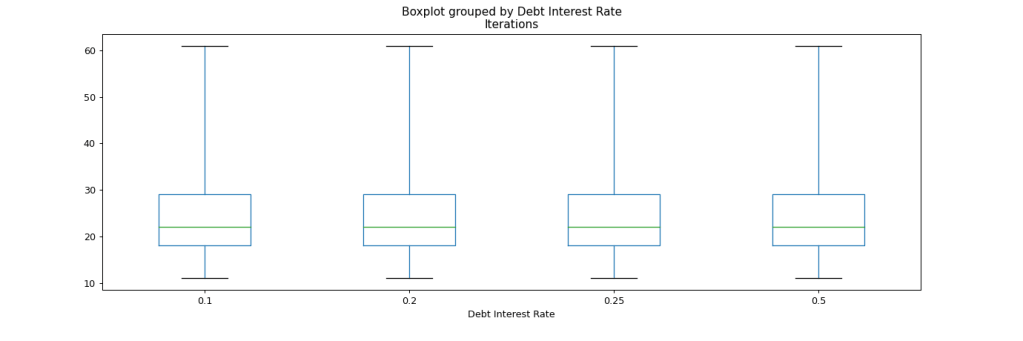
This comes as no surprise when we bring to mind that now we reduce debt to zero in every iteration, so debt interest never plays a significant role. Still this is a strategy I have rarely seen followed with great discipline in practice.
Conclusion
The “zero bug policy” that some organizations follow and many more discuss with great controversy is not so much an idealistic utopia as it is a mere life insurance.
And it’s not as much an idealistic utopia as it is a basic starting point, either. In order for it to really work well as a life insurance, we need to understand debt with a very broad definition, going way beyond “bugs”. Postponed refactorings are a form of debt as well as postponed documentation work, compliance aspects, you name it.
At least these newer simulations suggest that this will be the policy that greatly reduces your organization’s vulnerability around debt, particularly when those parameters are neither well known nor understood.
In a complex environment, the quest should not be to control the parameters, but to find strategies to deal with uncertainty.
Appendix
Simulated Combinations of Parameters:
| Feature Invest (after debt reduction) | Productivity Improvement (after debt reduction) |
|---|---|
| 50% | 50% |
| 60% | 40% |
| 70% | 30% |
| 80% | 20% |
| 90% | 10% |
Simulated Debt Interest Levels:
- 10%
- 20%
- 25%
- 50%
